Live build · NFL data systems
Brokaw Bets
A public NFL research dashboard that starts with the matchup you are checking and keeps its moving pieces in view.
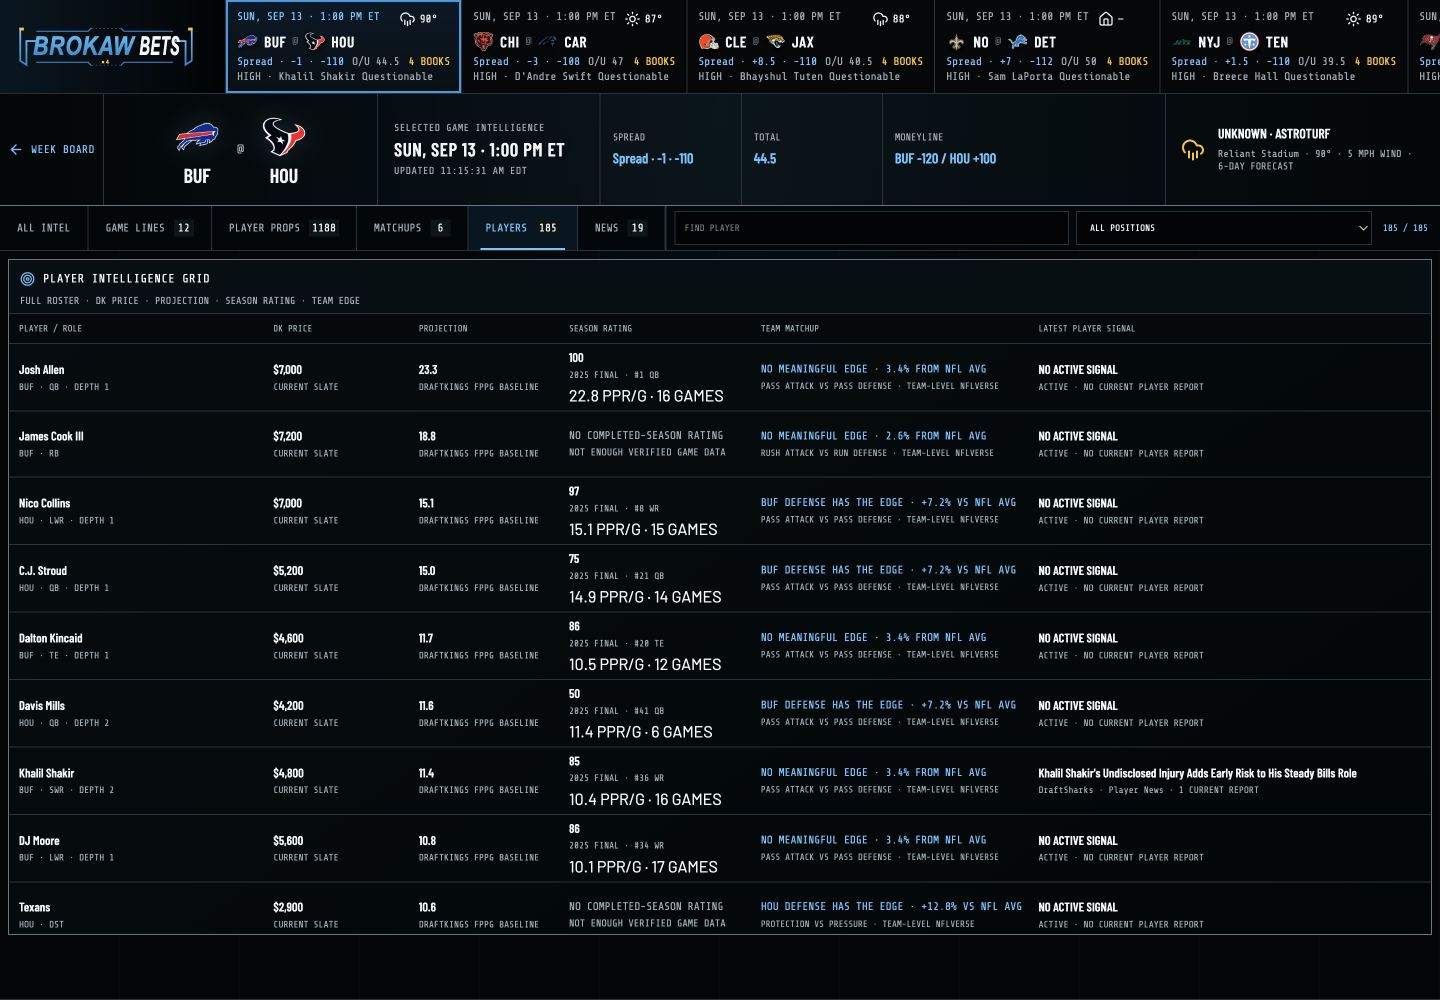
Player context, props, DFS, weather, news, and game data come together around one question: what changed, who does it affect, and what should I inspect before kickoff?
The operating question
When I have five minutes before a game, I do not want six tabs telling partial truths.
ESPN is excellent for following the league. Brokaw Bets starts closer to the decision: the exact game, the players involved, the lines on the board, the weather, and the reporting that may have changed the picture.
I built the first version in seven days because I wanted a useful football tool and a hard data problem. I am a Panthers PSL owner. Football was already going to get too much of my attention, so I gave the hobby a deadline, real records, and a screen I would actually use.
The result is a personal NFL matchup, DFS, and prop-research tool. It runs in the browser. The page you are reading is the build dossier behind it.
Use Brokaw Bets before the next game- 7 days
- from idea to public build
- $0
- paid for access to the sources used here
- 3 source samples
- 18,675 player-stat rows · 6,455 odds observations · 2,544 headlines
Those source samples are separate captures, not one aggregate live total. Large row counts do not create an edge. They create more work unless the system keeps the context straight.
What the product makes easier
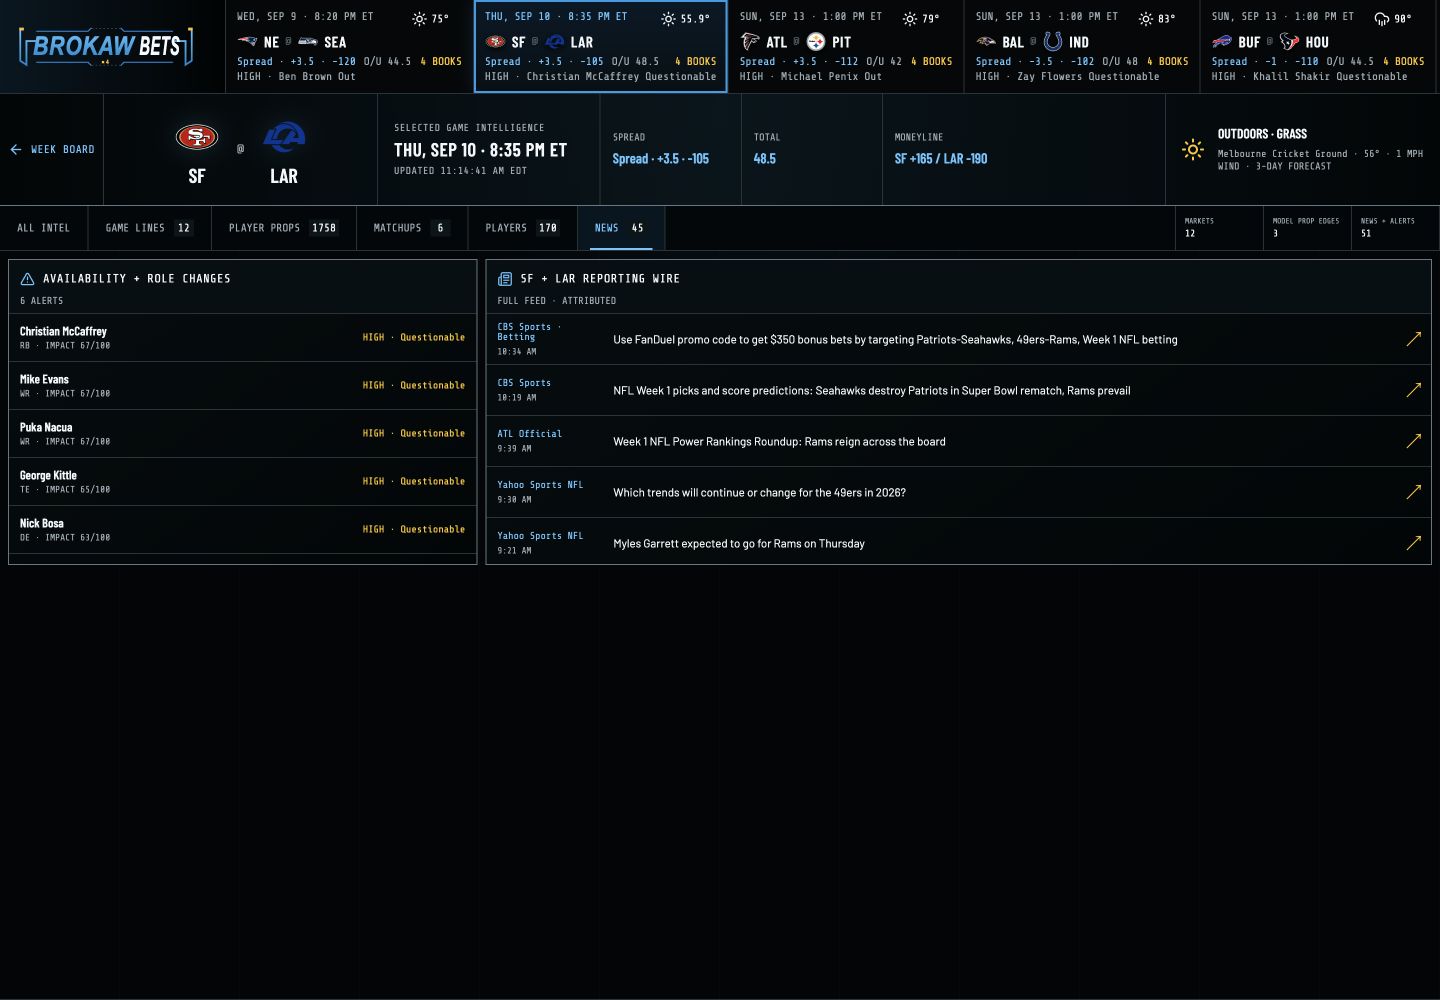
The dashboard starts with the game, then keeps the evidence nearby.
One game can involve moving market prices, injuries, weather, reporting, player roles, DFS salary, historical reference data, and different kinds of matchup context. A useful working view has to bring those records together without quietly pretending they all mean the same thing.
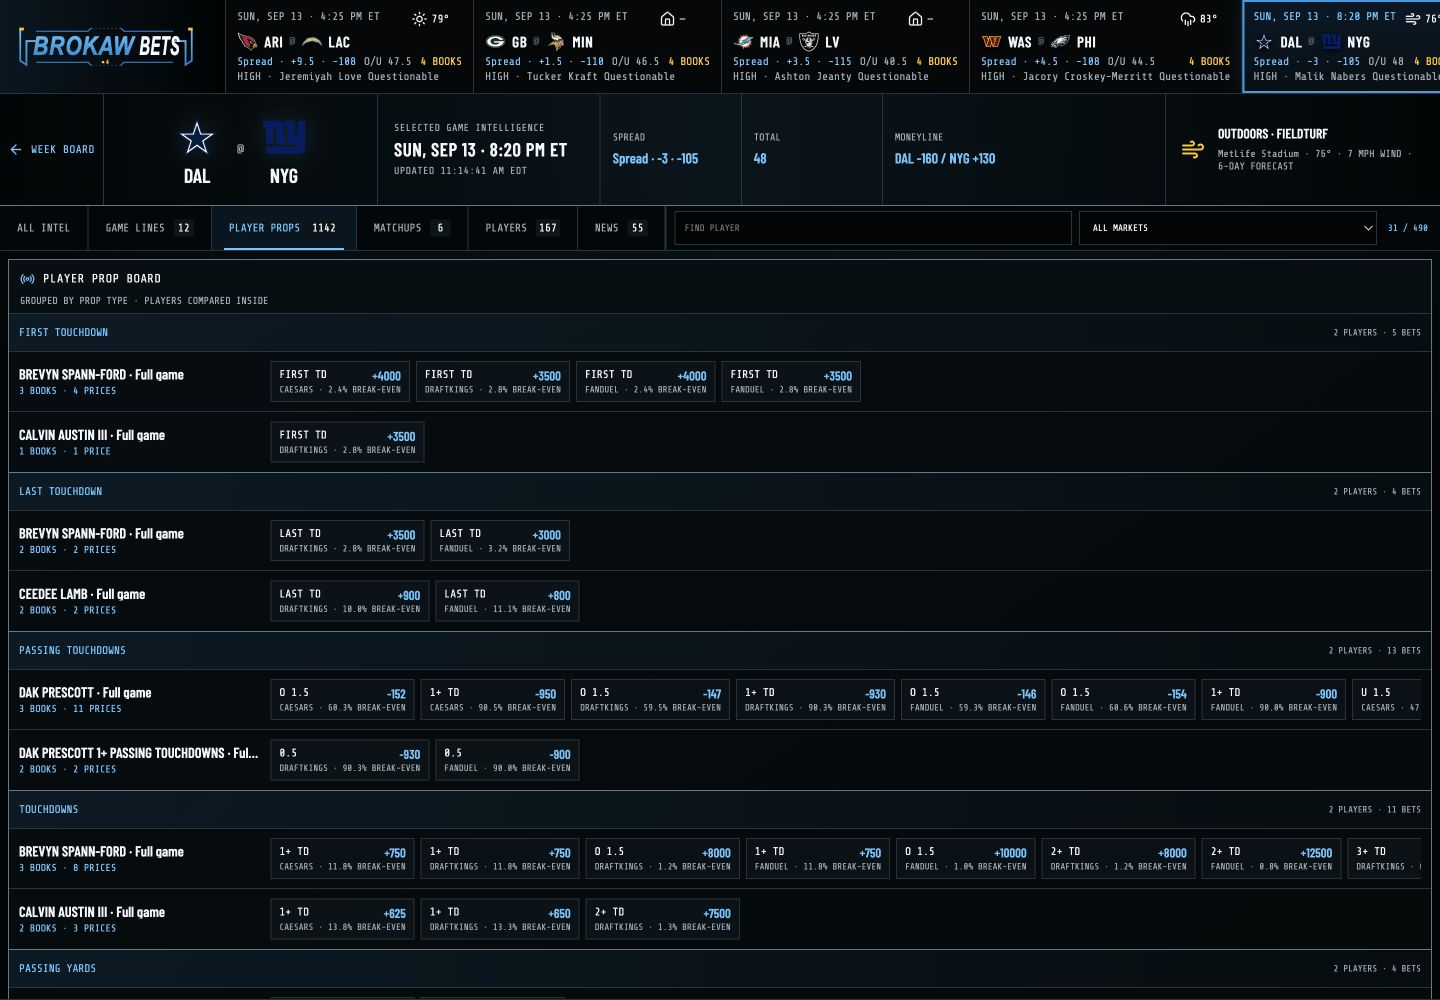
That is why a market price in Brokaw Bets carries its player, game, market, side, line, book, source, and time context. A headline carries the publisher, URL, source time, and the player or game it may affect. Similar-looking rows are not automatically the same claim.
A failure worth keeping
The page said GAME_NOT_FOUND. The schedule already had the game.
One direct game route only searched a narrow live-board window. When that window missed, it gave up without checking the retained season schedule. The data existed. The retrieval path was wrong.
I added a schedule fallback. The page could resolve the game, lines, props, rosters, and reporting that had been sitting behind the wrong lookup. That is an ordinary repair. It is still more valuable than a clean AI explanation of a record the application never retrieved.
- Symptom
- One direct game page returned
GAME_NOT_FOUND. - What existed
- The retained season schedule already included the game.
- Cause
- The route searched one narrow live-board window and stopped there.
- Repair
- Fall back to the season schedule when the live board has no match.
A CRM can hold the account. Analytics can hold the session. An ad platform can hold the campaign touch. The answer is still wrong when the operating view never reaches the record it needs.
The phone is part of the job
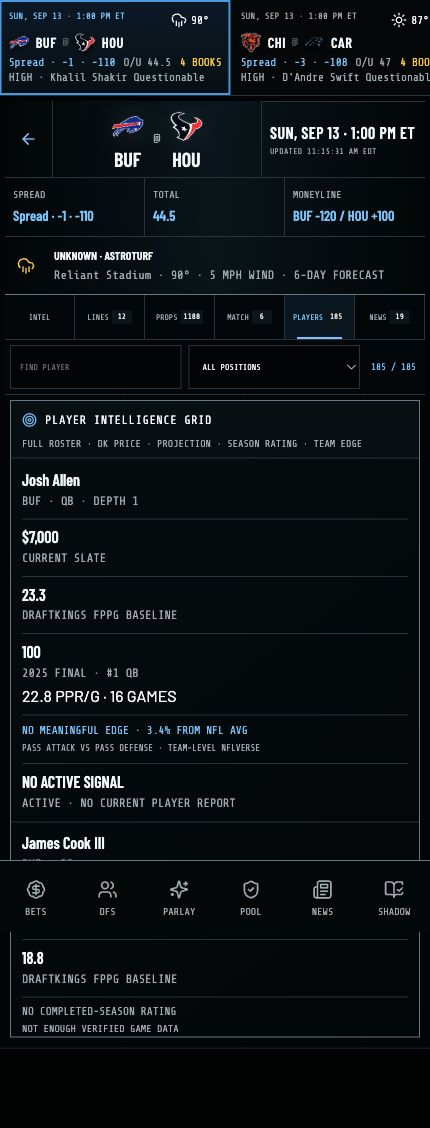
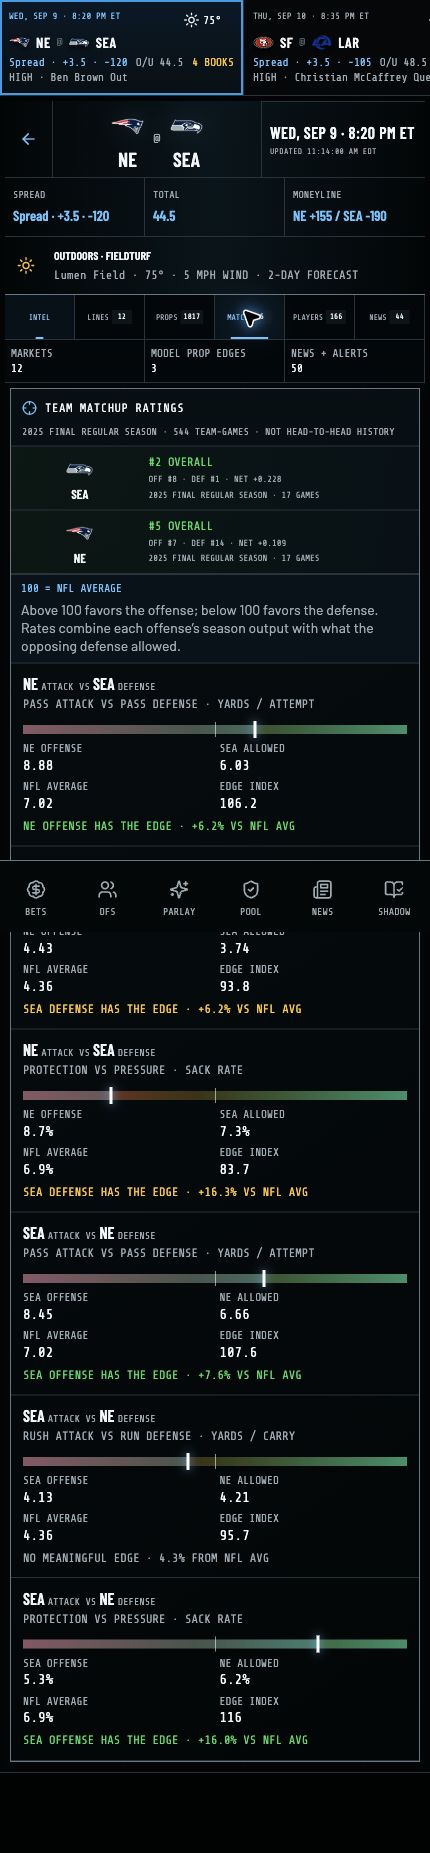
The phone view keeps the hierarchy of the record intact.
I use the desktop dashboard when I want to compare a lot of information. The phone view is for the parking lot, a stadium seat, or the few hours before kickoff when the answer is moving. It starts with the game, then keeps the player, matchup, line, weather, and reporting context readable as the page narrows.
How the data work is divided
Different information has different clocks. The collection cannot run on one generic refresh.
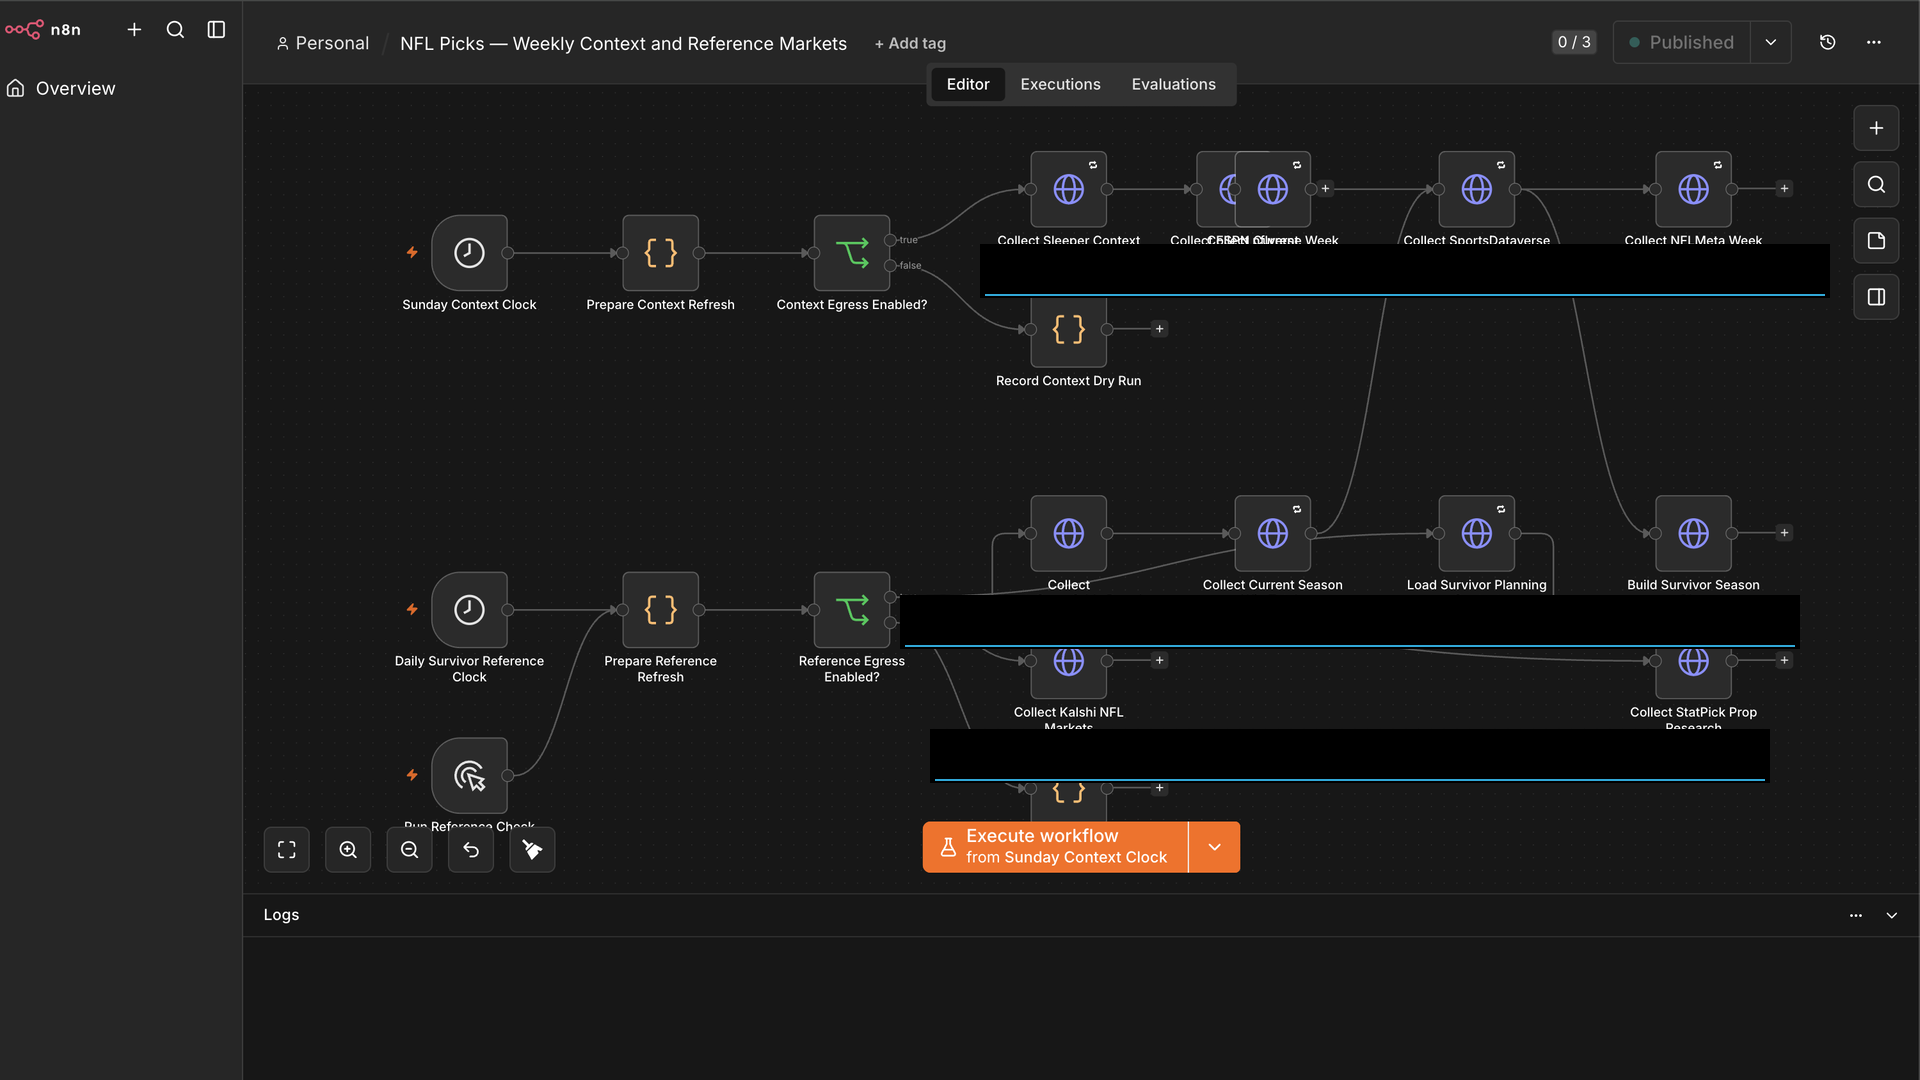
Weather, roster availability, player props, reporting, historical reference data, and the game board change on different schedules. The build uses n8n workflows to collect and route that changing source material. Python handles the work that needs to be consistent every time: normalizing fields, matching identities, saving source evidence, and calculating comparisons.
Hermes is used as a bounded review layer when the problem is language, ambiguity, or conflicting reporting. It can inspect an evidence packet and surface a conflict. Scheduling refreshes, enforcing rules, and routine arithmetic stay in deterministic code.
Working product walkthrough
A short desktop walkthrough of the working dashboard. It documents the product surface and does not establish a betting edge or settled model evaluation.
Why this matters beyond football
Football exposes data mistakes quickly. Marketing and revenue systems let them hide longer.
A buyer can appear as a CRM contact, an ad-platform identifier, a web session, a sales activity, and three versions of a company name. A model can reduce that mess to a confident paragraph in seconds. It cannot repair an identity match, a stale field, or a duplicated claim on its own.
01
Did we join the right records?
A player line needs the game, player, market, side, book, and time. A revenue decision needs the same care around person, account, campaign, offer, time window, and attribution rule.
02
Are we counting one claim five times?
An injury update becomes an official notice, a fantasy item, a preview, and five rewrites. The same problem appears when intent signals, syndicated coverage, or conversion events are treated as independent confirmation.
03
Was the information available when the decision was made?
Later knowledge makes any system look smarter. The durable record is the one that keeps the source time, decision time, and evidence available for inspection after the outcome.
04
Did the correction improve the next run?
A learning loop keeps the evidence, records the decision, attaches the outcome, changes one rule, and checks comparable cases. That is the standard before a lead score or campaign recommendation should change.
Use the build. Find the hole.
The dashboard is public because the useful feedback comes from somebody trying to use the real thing.
Open a matchup. If something is missing, stale, unclear, or hard to find, tell me. That becomes the next build list.
Early notes from the build